Purpose and usage of the Ember Elicitation Desk app

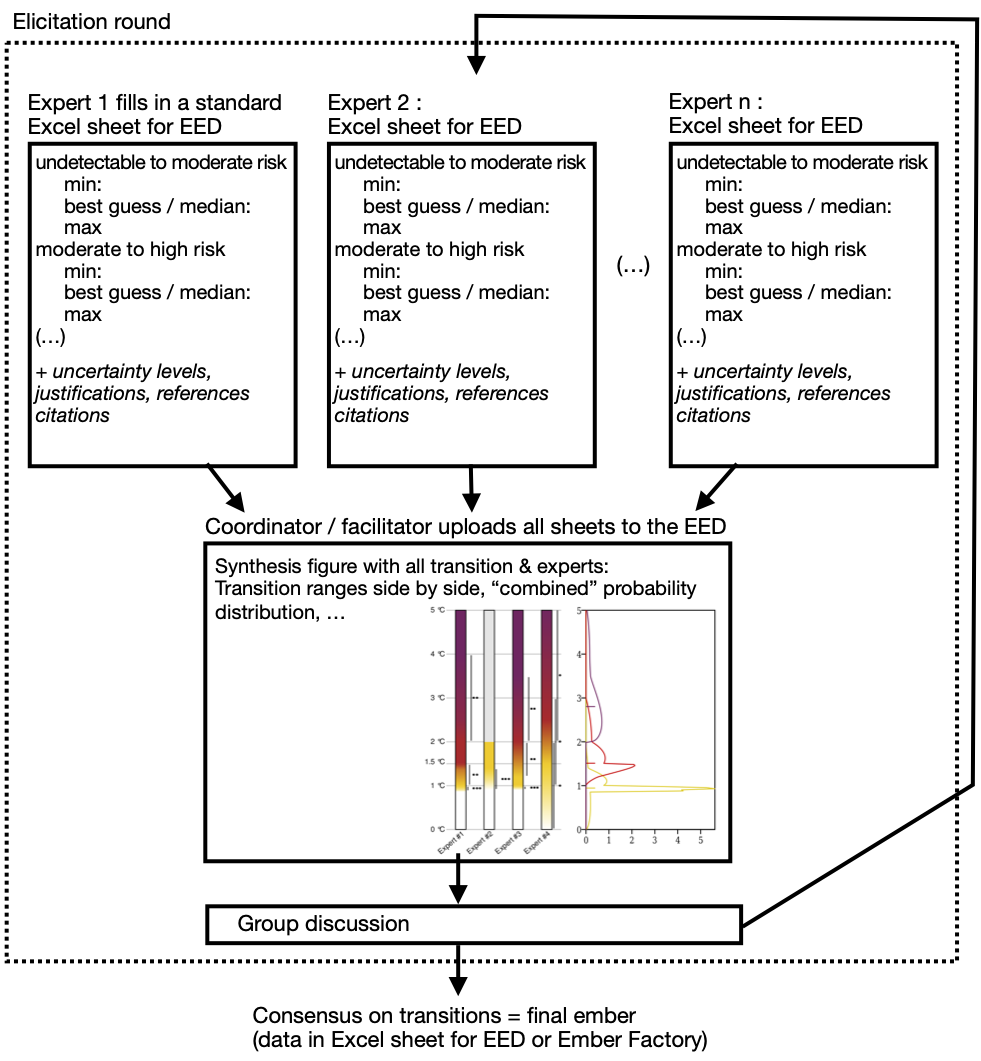
The Ember Elicitation Desk (EED) is a tool to help synthesize the risk assessment by several experts in the form of a 'burning ember' diagram. The EED is thus aimed as facilitating structured expert elicitation, by automating a part of it that would otherwise involve repetitive data manipulation. It aims at speeding up the process and reducing the risk of errors from copy-pasting data. The figure on the right illustrates this process (click on the figure to enlarge).
An expert elicitation involves other steps which are not considered here, such as selecting experts, listing relevant data from the literature, and linking hazard levels considered in specific references to a common hazard metric (almost universaly global mean surface temperature increase). This app presents a set of data together in a standardised way, similarly to figure 5 in Zommers et al. 2020. While it provides a tentative synthesis ember, this synthesis is provided for information: it does not prejudge the final outcome of the discussion among experts, which expresses their judgment.
How to use
To use the EED, each expert from a group needs to fill an Excel sheet providing his·her assessment of the risks for a given system. If you assess risks for several systems, one sheet must be used for each of them (and always one for each expert). All files need to be submitted to the EED at once (on the Data processing page).
The file format must follow EED's template (which is itself inspired by past IPCC practice).
The template file contains general guidelines about how experts are expected to provide data. It summarizes key aspects of burning embers: how risk levels are defined, how transitions are defined, what is the 'best estimate' or 'median' point within a transition... We hope this helps but do not want to "impose" anything: if you do not agree with these guidelines or explanations, you may provide other advice to your group of experts. If there is doubt about the consistency of your guidelines with the EED, please contact us. The intention is to improve this app given feedback from expert groups, so your help would be appreciated.
Example files
A set of files is available to test the application:
Ember Elicitation SRCCL files set
These files correspond to the first elicitation round for the ember on "food supply instabilities" in IPCC SRCCL. Part of the resulting diagram is identical (except for minor technical differences) to figure 5 in Zommers et al. 2020.
To use this example, please uncompress the zip file: you should get 4 Excel files (the EED does not read zipped folders for the moment). To submit the files, start from the home page. These files are intended for testing only: to start a new expert elicitation, we advise you to use the template. In particular, the test files do not include the proposed guidelines for authors on how to fill the template.
Anonymization
Input from experts is shown in a random order. Currently, this order changes at each run of the EED, so if you process the same data twice, you won't get the embers corresponding to each expert shown in the same order.
Interpretation of the obtained diagram
The diagrams have two parts:
-
Embers are drawn from the data provided by each individual expert, together with the transition ranges (vertical lines) and the confidence levels (* for low confidence (...) **** for very high confidence).
-
On the right, the diagram shows an aggregated probability density function for the group of experts, as presented in figure 5 in Zommers et al. 2020.
Both are provided as illustrations of the assessment of experts, individually and jointly. We hope that it will help you in the process of finding a consensus in your group. An advantage of this tool is that after getting the diagram, experts may potentially update their Excel sheet, send it back to a coordinator / facilitator, and get a new synthesis diagram (as in the two expert elicitation rounds suggested in Zommers et al.): this can be done faster, and thus more interactively, then before. Fore more information and/or for providing suggestions, please contact us.
Best guess or central point within the transition
There are slightly different ways to define a "central point" within a transition. It is frequently defined as a "median" but has also been defined as a "most likely" or "best guess" position for the transition. Both options are available in the EED, and additional explanations are provided in the template. For more information, please contact us.
Choice of probability distribution
The EED may provide probability density functions based on either triangular or "modified-PERT" distributions. The triangular distribution is proposed due to its simplicity, while the modified-PERT provides smoother curves. The triangular distribution was used for expert elicitation in e.g. the IPCC SRCCL (Zommers et al. 2020). This is not expected to have substantial consequences for the interpretation of the diagrams, hence if are not interested in this detail, you may keep the default setting. For more information, please contact us.
Known limitation to 'standard transitions'
This application can only process 'standard transitions' (undetectable to moderate, moderate to high and high to very high). Therefore, the flexibility available in the EmberFactory (which allows arbitrary transitions and colours) is not yet available here.